Phenotyping chronic tinnitus patients using self-report questionnaire data: cluster analysis and visual comparison
Knowledge of different disease phenotypes can help understand (a) which patient subpopulations seek treatment and (b) the response to treatment within each subgroup. In this paper, we presented a workflow to (i) determine distinct phenotypes of medical conditions in high-dimensional data, (ii) visualize these phenotypes to explore and compare essential subpopulation characteristics, and (iii) interactively inspect them and their change over time with an interactive web application. We evaluated our workflow by identifying four distinct phenotypes of tinnitus patients.
Paper authors: Uli Niemann, Petra Brueggemann, Benjamin Boecking, Wilhelm Mebus, Matthias Rose, Myra Spiliopoulou, and Birgit Mazurek
Scientific Reports
By Uli Niemann in Research Tinnitus
October 2, 2020
Abstract
Chronic tinnitus is a complex, multi-factorial symptom that requires careful assessment and management. Evidence-based therapeutic approaches involve audiological and psychological treatment components. However, not everyone benefits from treatment. The identification and characterisation of patient subgroups (or “phenotypes”) may provide clinically relevant information. Due to the large number of assessment tools, data-driven methods appear to be promising. The acceptance of these empirical results can be further strengthened by a comprehensive visualisation. In this study, we used cluster analysis to identify distinct tinnitus phenotypes based on self-report questionnaire data and implemented a visualisation tool to explore phenotype idiosyncrasies. 1228 patients with chronic tinnitus from the Charité Tinnitus Center in Berlin were included. At baseline, each participant completed 14 questionnaires measuring tinnitus distress, -loudness, frequency and location, depressivity, perceived stress, quality of life, physical and mental health, pain perception, somatic symptom expression and coping attitudes. Four distinct patient phenotypes emerged from clustering: avoidant group (56.8%), psychosomatic group (14.1%), somatic group (15.2%), and distress group (13.9%). Radial bar- and line charts allowed for visual inspection and juxtaposition of major phenotype characteristics. The phenotypes differed in terms of clinical information including psychological symptoms, quality of life, coping attitudes, stress, tinnitus-related distress and pain, as well as socio-demographics. Our findings suggest that identifiable patient subgroups and their visualisation may allow for stratified treatment strategies and research designs.
Important figure
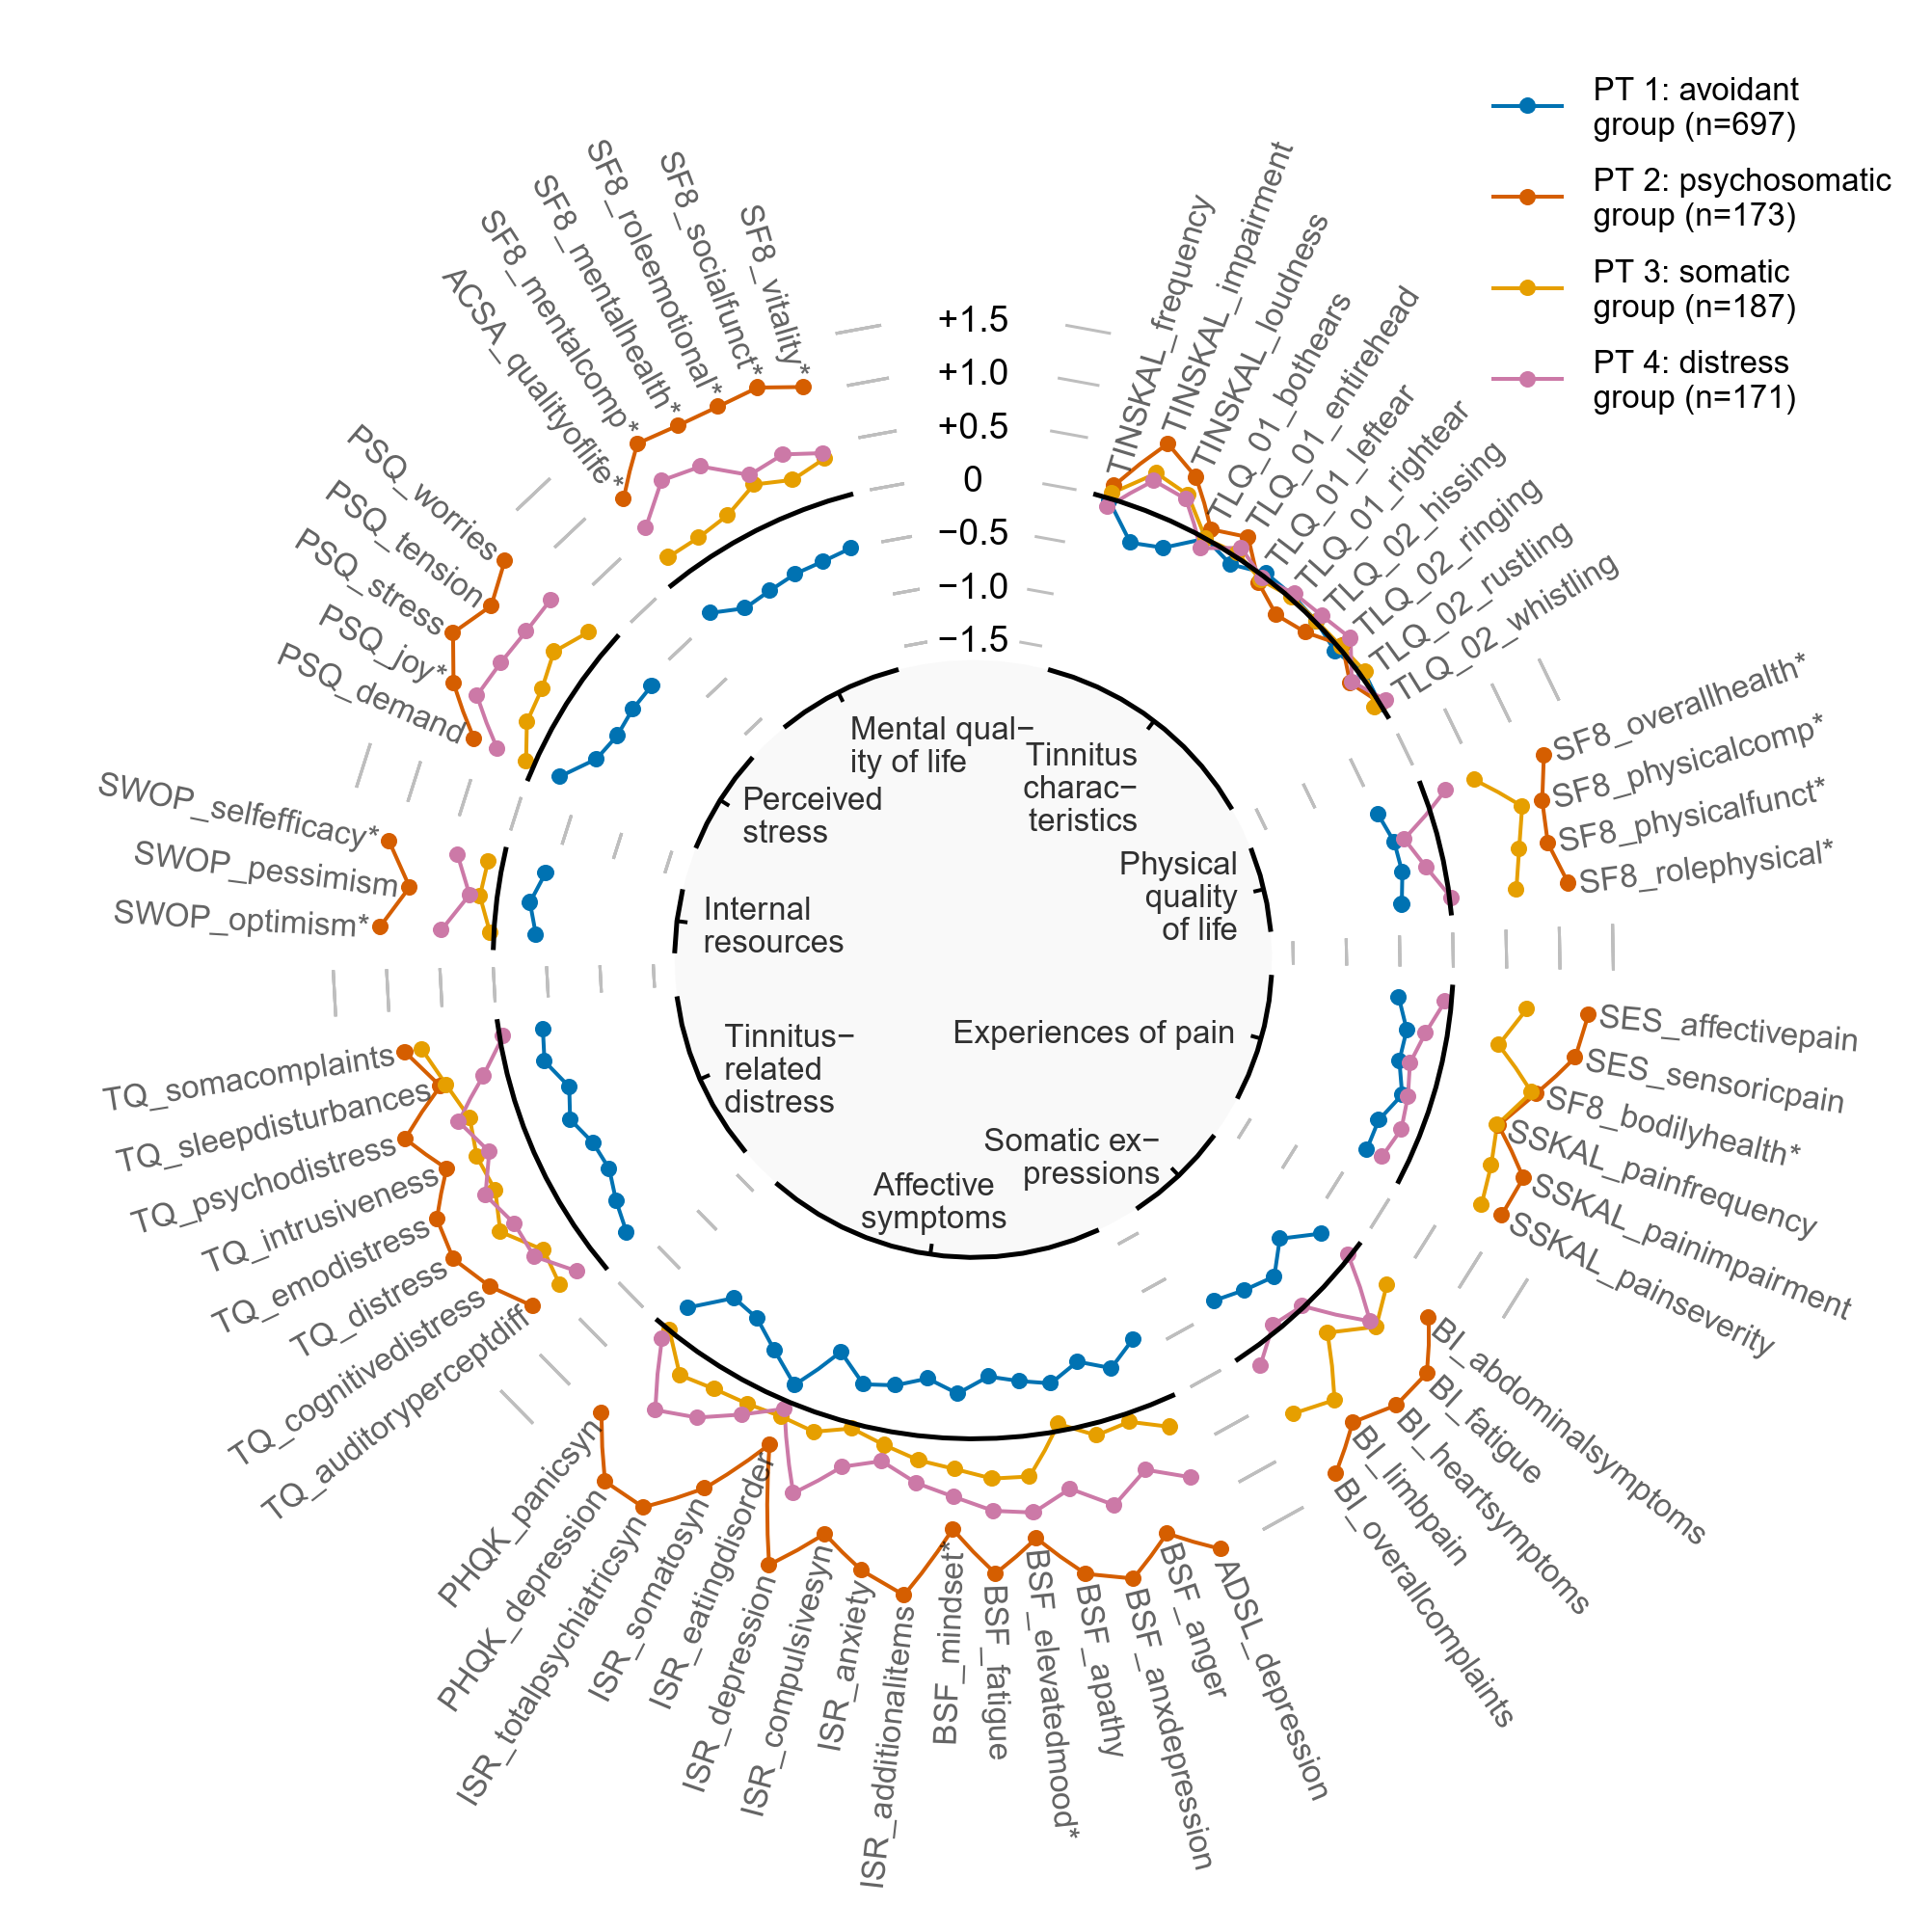
Figure 2. Radar line chart juxtaposing the 4 phenotypes. (a) Phenotype 1 (PT1) characterises the patient subgroup with lowest health burden among all phenotypes. (b) PT2 represents the most suffering subgroup, with all of the psychosomatic and somatic measurement averages exceeding the population mean + 0.5 standard deviations (SD). PT3 (c) exhibits above population average scores for somatic indicators whereas PT4 (d) is characterised by increased distress scores, including subjective stress and perceived quality of life. Features are arranged in a circular layout. In the chart, a point shows a feature’s (z-score normalised) within-phenotype average. In each feature category (labels in inner circle), points are connected with line segments. Points and lines are coloured by cluster. Features were grouped into 9 categories defined by tinnitus experts. The categories are shown within the inner circle.
BibTeX citation
@article{Niemann:SREP_Pheno2020,
  author    = {Niemann, Uli and Brueggemann, Petra and Boecking, Benjamin and
               Rose, Matthias and Spiliopoulou, Myra and Mazurek, Birgit},
  journal   = {Scientific Reports},
  title     = {{Phenotyping chronic tinnitus patients using self-report
                questionnaire data: cluster analysis and visual comparison}},
  year      = {2020},
  pages     = {1--10},
  volume    = {10},
  doi       = {10.1038/s41598-020-73402-8},
  url       = {https://doi.org/10.1038/s41598-020-73402-8},
}
- Posted on:
- October 2, 2020
- Length:
- 3 minute read, 456 words
- Tags:
- Clustering Data Visualization
- See Also: