Classification of cardiac cohorts based on morphological and hemodynamic features derived from 4D PC-MRI data
We investigate the potential of morphological and hemodynamic features extracted from measured blood flow data in the aorta to classify hear-thealthy volunteers (HHV) and patients with bicuspid aortic valve (BAV). Furthermore, we determine features that distinguish male vs. female patients and elderly HHV vs. BAV patients. We propose a data analysis pipeline for cardiac status classification, encompassing feature selection, model training, and hyperparameter tuning.
Paper authors: Uli Niemann, Atrayee Neog, Benjamin Behrendt, Kai Lawonn, Matthias Gutberlet, Myra Spiliopoulou, Bernhard Preim, and Monique Meuschke
2022 IEEE 35th International Symposium on Computer-Based Medical Systems (CBMS)
By Uli Niemann in Research Cardiovascular Diseases
July 23, 2022
Abstract
An accurate assessment of the cardiovascular system and prediction of cardiovascular diseases (CVDs) are crucial. Cardiac blood flow data provide insights about patient-specific hemodynamics. However, there is a lack of machine learning approaches for a feature-based classification of heart-healthy people and patients with CVDs. In this paper, we investigate the potential of morphological and hemodynamic features extracted from measured blood flow data in the aorta to classify hear-thealthy volunteers (HHV) and patients with bicuspid aortic valve (BAV). Furthermore, we determine features that distinguish male vs. female patients and elderly HHV vs. BAV patients. We propose a data analysis pipeline for cardiac status classification, encompassing feature selection, model training, and hyperparameter tuning. Our results suggest substantial differences in flow features of the aorta between HHV and BAV patients. The excellent performance of the classifiers separating between elderly HHV and BAV patients indicates that aging is not associated with pathological morphology and hemodynamics. Our models represent a first step towards automated diagnosis of CVS using interpretable machine learning models.
Important figure
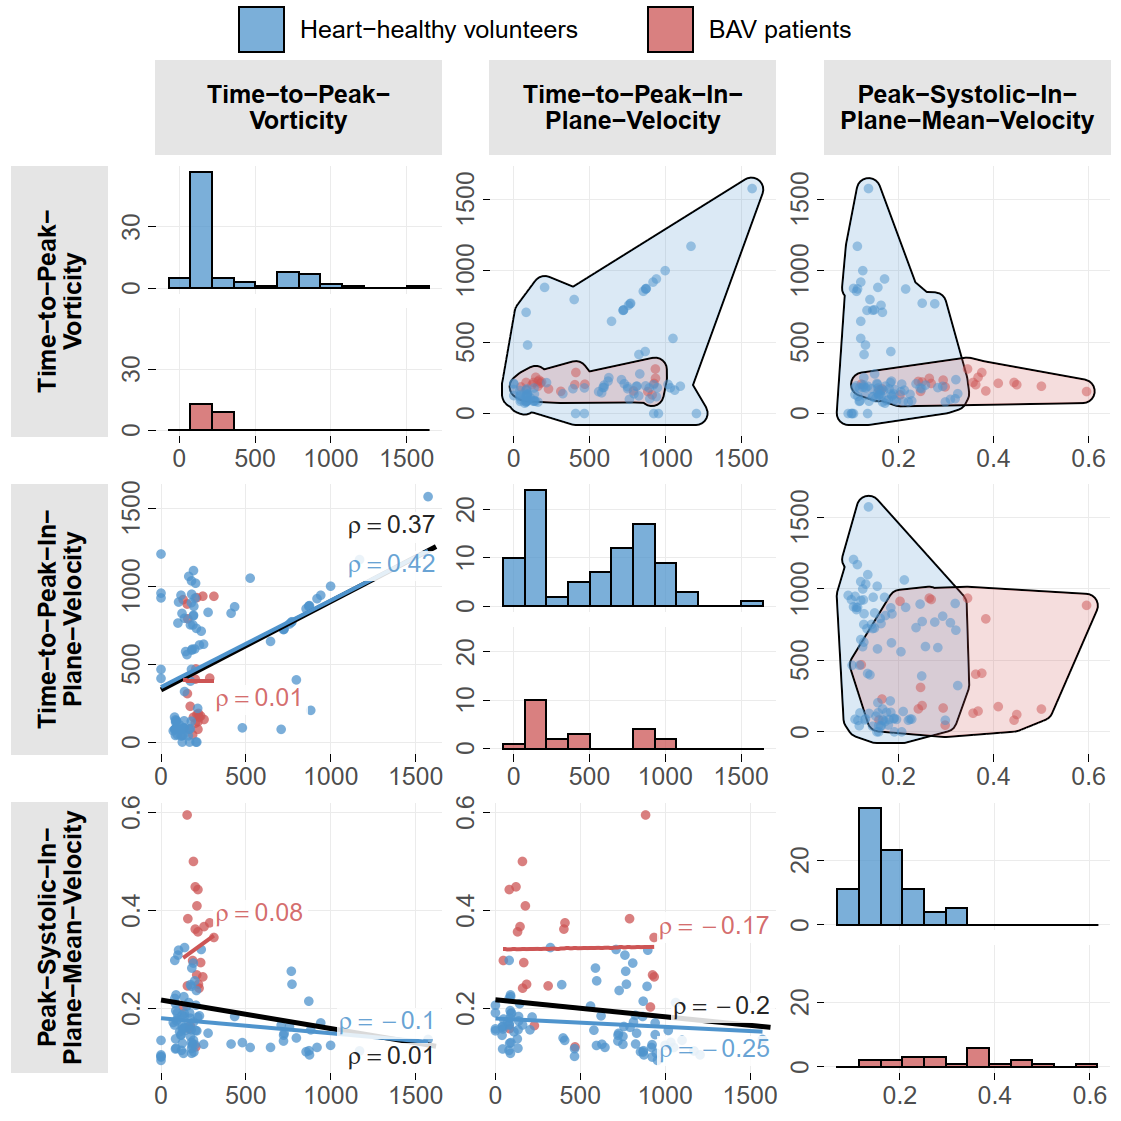
Figure 3. Plot matrix for features of the best model for CT 1 (SFS+RF). The pairwise relationships of the features selected for the best combination of feature selection and classification algorithm are shown for CT 1. Scatterplots illustrate the relationship between the feature labeled at the top of the column (x-axis) and the feature labeled at the left of the row (y-axis). Colored lines depict the strength of the linear relationship, and labels display the Spearman correlation coefficient (ρ). Hull geometries indicate the overlap between the two subgroups in the depicted 2D feature space. The histograms on the main diagonal show the distribution of a feature for each subgroup.
BibTeX citation
@InProceedings{Niemann:CBMS2022,
  author    = {Niemann, Uli and Neog, Atrayee and Behrendt, Benjamin and Lawonn, Kai and Gutberlet, Matthias and Spiliopoulou, Myra and Preim, Bernhard and Meuschke, Monique},
  booktitle = {IEEE Computer-Based Medical Systems (CBMS)},
  title     = {{Classification of cardiac cohorts based on morphological and hemodynamic features derived from 4D PC-MRI data}},
  year      = {2022},
  note      = {Accepted, to appear},
  doi       = {10.1109/CBMS55023.2022.00081},
}
- Posted on:
- July 23, 2022
- Length:
- 2 minute read, 377 words
- Categories:
- Research Cardiovascular Diseases